The book, Canadian Edition 2025
Facts on 22 prominent climate topics
What Net Zero asks of Canadians, what it would change, and what the evidence says about the climate. Each topic is a short chapter with its figures and sources, in the style of Climate at a Glance.
Free for members. Sign in or register — it takes a minute.
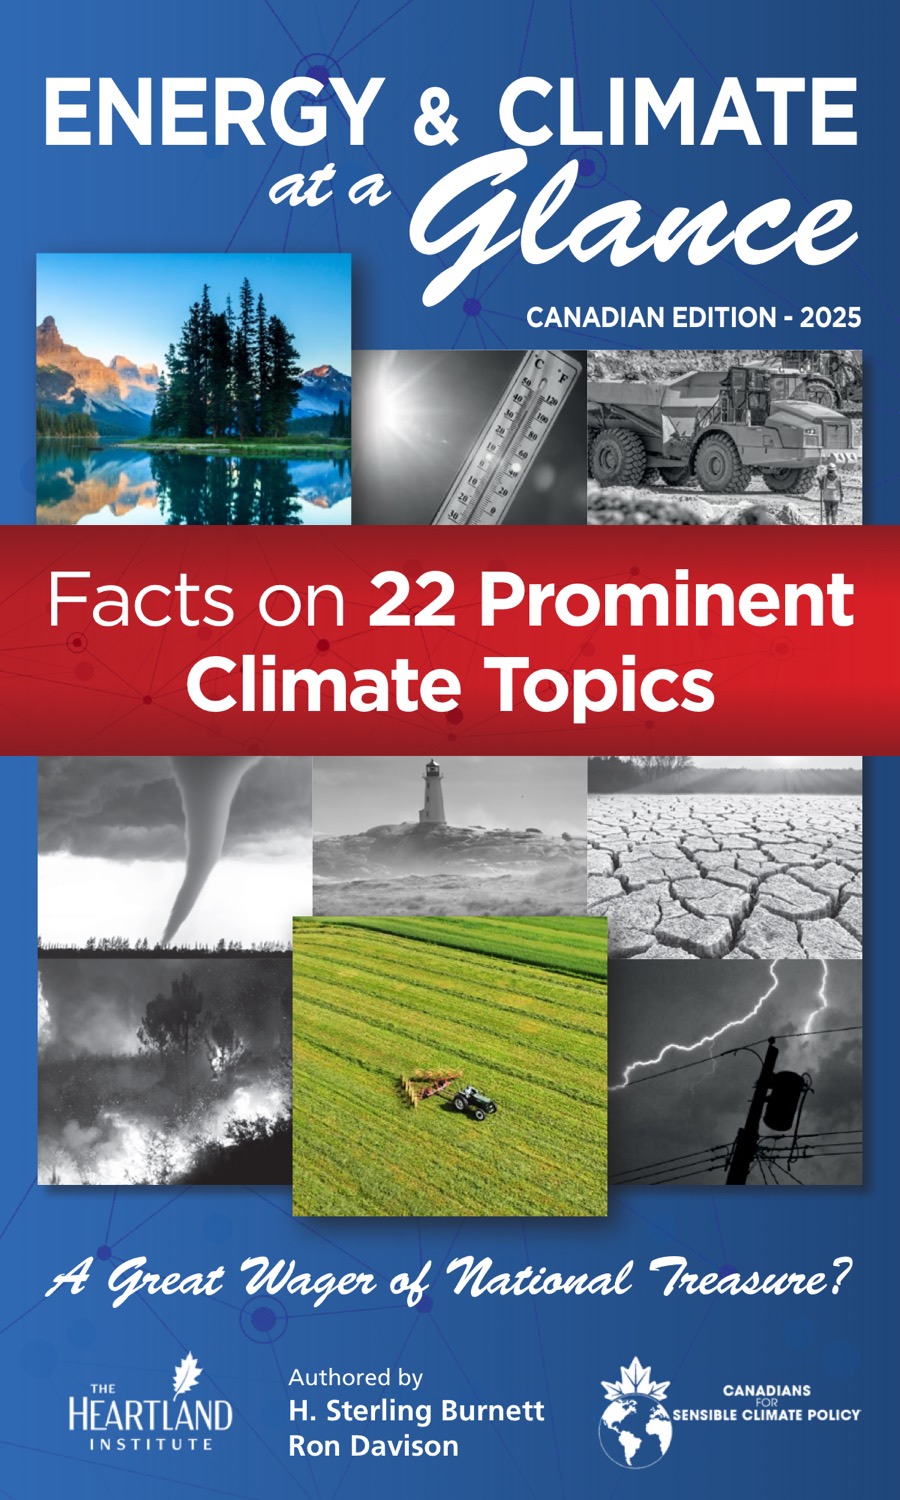
By H. Sterling Burnett and Ron Davison. Published by Canadians for Sensible Climate Policy. 86 pages. ISBN 978-1-0691053-0-1.
Inside the book
22 topics in 5 sections. Each section makes one case.
Section 1 of 5
Canadian Climate Commitments to Net Zero at 2050
Ottawa promised Net Zero. Nobody has shown Canadians the bill.
The topics
- 01The Paris Agreement and Net Zero
- 02Canada’s CO2 Nationally Determined Contributions (NDCs)
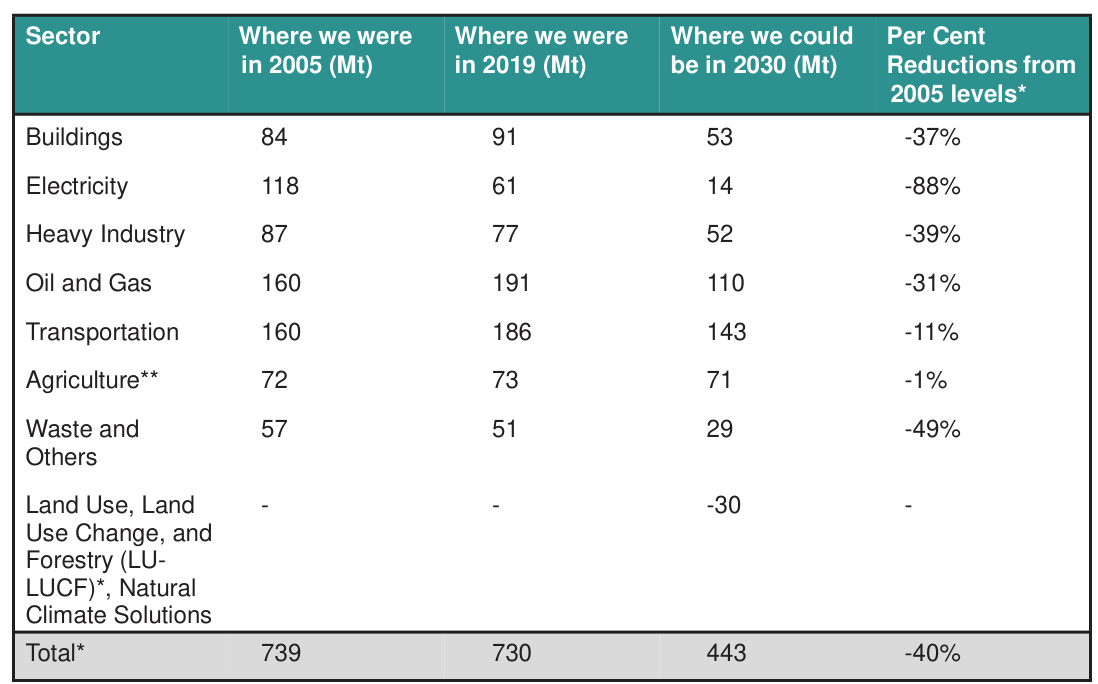
- 03Canada’s Path and Obstacles to Net Zero
- 04Economic Impact of Meeting Global and Canadian Targets
- 05Environmental and Social Impact
Section 2 of 5
Domestic CO2 Restrictions Are Futile and Harmful
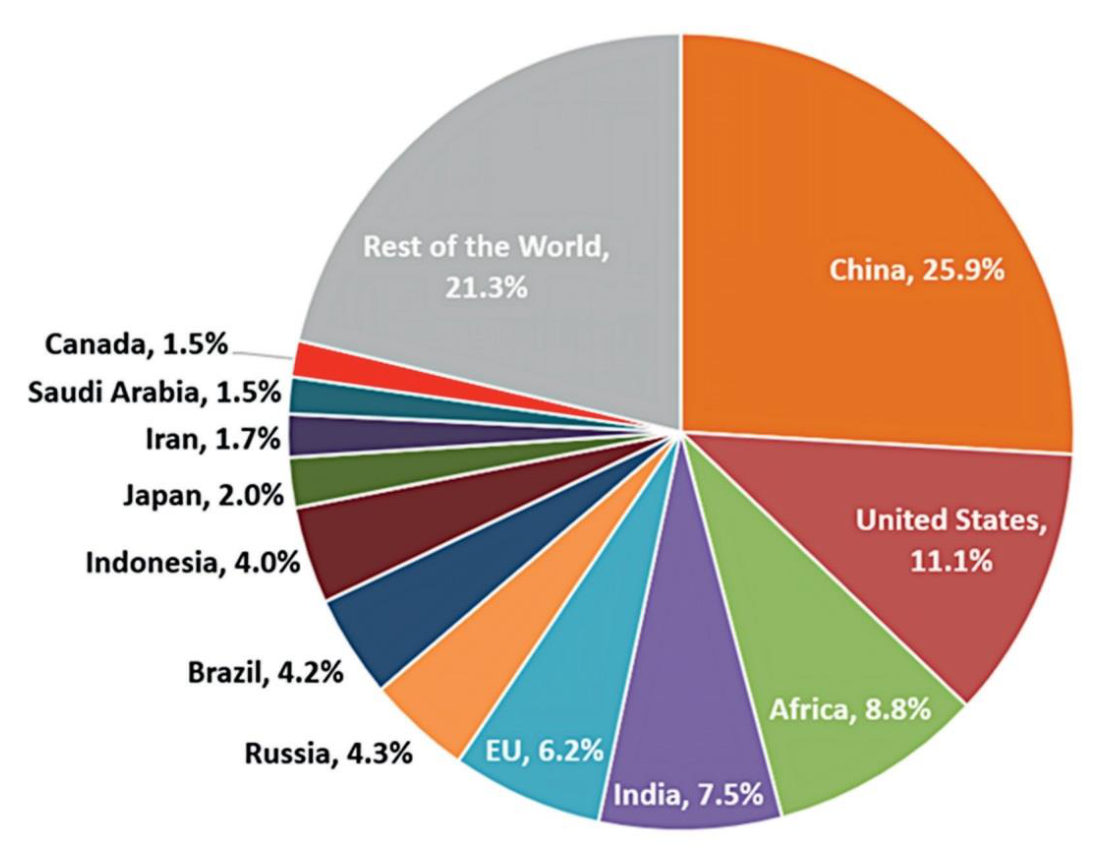
Canada’s share of global emissions is small. Our sacrifices won’t change the climate.
The topics
- 06Can Net Zero Goals Be Realistically Met?
- 07How Will Canada’s Net Zero Sacrifice Impact Global Emissions?
- 08What Will Our Sacrifices Cost? What Will We Gain?
- 09How Will Canada’s Climate Sacrifices Position the Nation Economically & Geopolitically?
Section 3 of 5
There Is No ‘Climate Crisis’
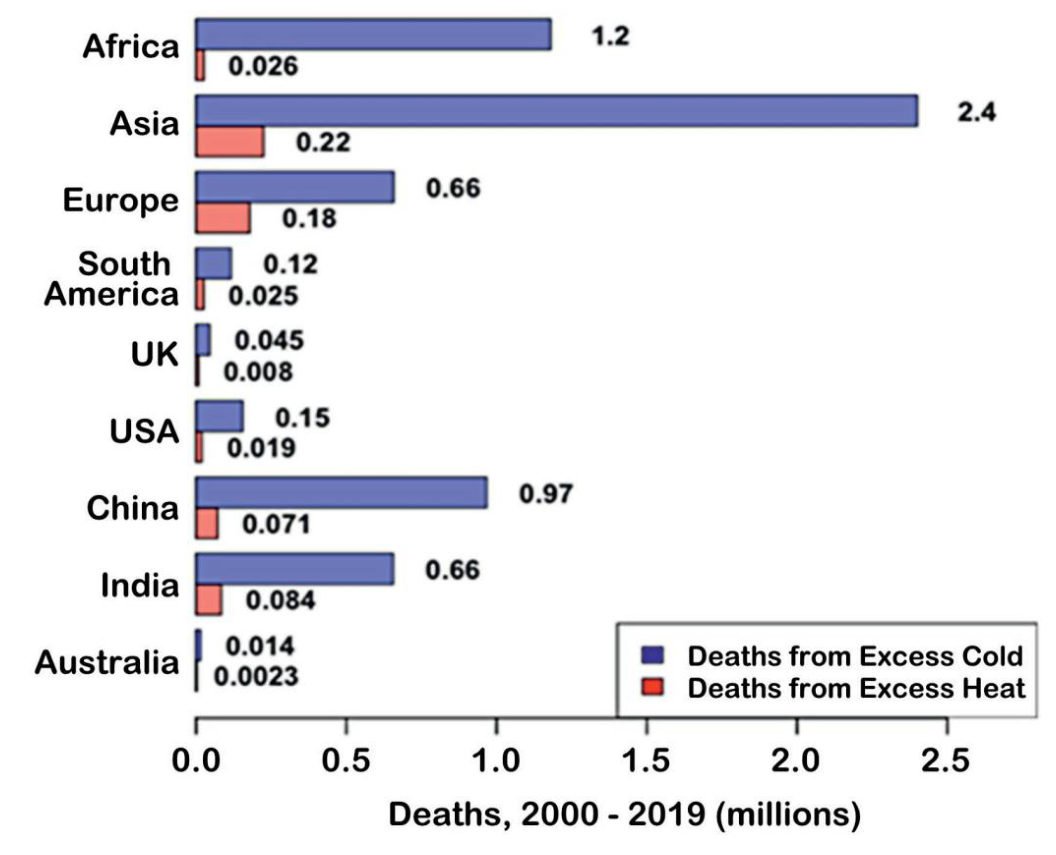
The data show no crisis, and cold still kills far more people than heat.
The topics
- 10CO2 Does Not Control the Temperature
- 11Climate Model Projections Don’t Reflect Real Temperatures
- 12Urban Heat Island Effect Boosts Surface Temperature Records
- 13Extreme Weather and Weather-Related Disasters Are Not Getting Worse
- 14Oceans Aren’t Acidifying, Islands Aren’t Disappearing, Sea Level Rise Is Normal
- 15Warming Is Saving Lives
Section 4 of 5
The Benefits of Fossil Fuels and CO2
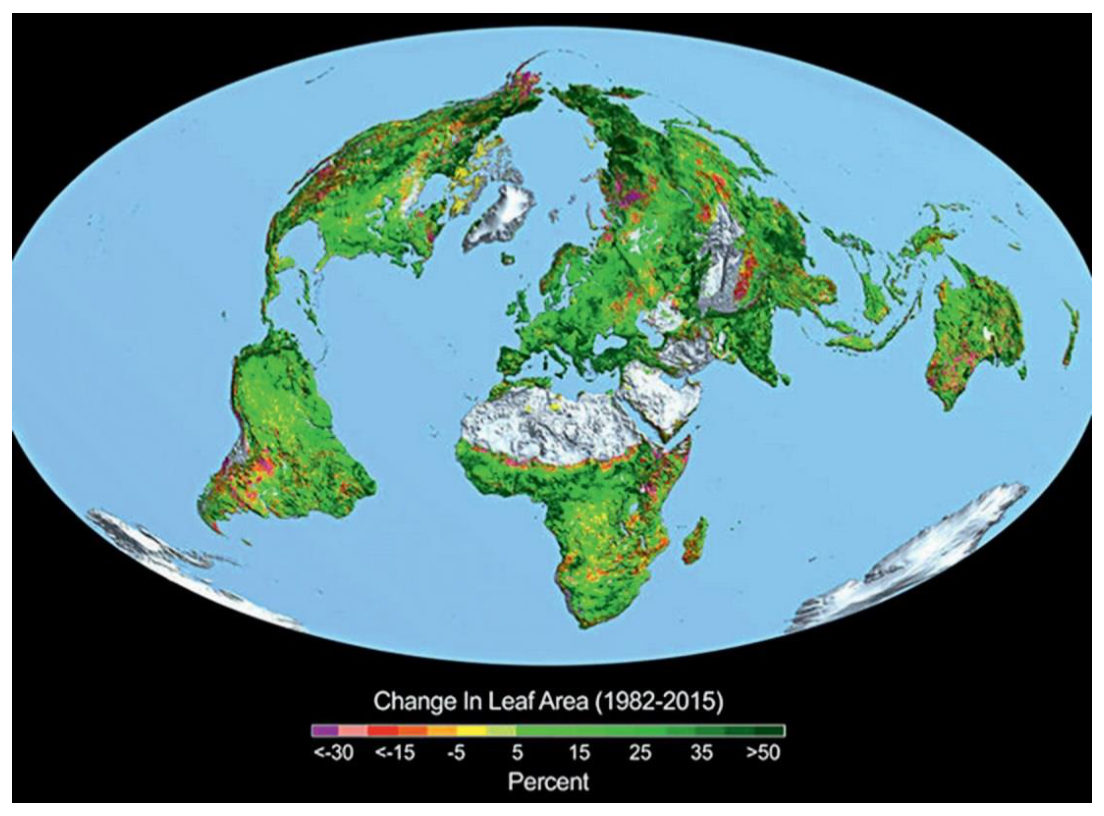
Fossil fuels and CO2 feed, heal, and green the planet.
The topics
- 16Petroleum Products
- 17Fossil Fuels in Agriculture, Transportation, and Medicine
- 18Poverty Rates, Lifespan, and Infant Mortality
- 19More CO2 Is Greening the Earth
- 20More CO2 Means More Food
- 21Warming Is Good for Civilization
Section 5 of 5
What Are Our Best Options?
Practical first steps, and a call for Canadians to lead.
The topic
- 22What Are Our Best Options?
Read the whole book
Every topic above has its own short chapter, with the figures and sources behind it. Members read it free online. Not a member yet? Registering takes a minute.
Styled after The Heartland Institute’s Climate at a Glance. Creative director: Donald Kendal, The Heartland Institute. Figures reproduced from the book’s graphics and references companion.